<?xml version="1.0" encoding="utf-8"?>
<feed xmlns="http://www.w3.org/2005/Atom">
    <id>https://nanx.io/blog</id>
    <title>nanx.io Blog</title>
    <updated>2026-09-01T00:00:00.000Z</updated>
    <generator>https://github.com/jpmonette/feed</generator>
    <link rel="alternate" href="https://nanx.io/blog"/>
    <subtitle>nanx.io Blog</subtitle>
    <icon>https://nanx.io/img/favicon.ico</icon>
    <entry>
        <title type="html"><![CDATA[The Gold Shadow Price]]></title>
        <id>https://nanx.io/blog/gold-shadow-price</id>
        <link href="https://nanx.io/blog/gold-shadow-price"/>
        <updated>2026-09-01T00:00:00.000Z</updated>
        <summary type="html"><![CDATA[The shadow price is a frame of reference for assessing how undervalued or overvalued gold is relative to a historical benchmark.]]></summary>
        <content type="html"><![CDATA[<p><strong>TL;DR:</strong> The <strong>shadow price</strong> is a theoretical framework for how gold might be valued if certain historical monetary conditions were restored. It is not a price forecast; it is a conceptual tool for measuring the gap between today's world and a scenario in which gold regains a more central role as a monetary anchor.</p>
<p><strong>*</strong> <strong><a class="" href="https://nanx.io/">nanx.io</a></strong> computes the <em>shadow price</em> and the <em>spot/shadow ratio</em> in real time (both discussed below).</p>
<p><img decoding="async" loading="lazy" alt="Gold coin of Eucratides I, Greco-Bactrian kingdom" src="https://nanx.io/assets/images/Monnaie_de_Bactriane_Eucratide_I_2_faces_1280-c14f0dcd5ed3e7d60327983acabf8652.jpeg" width="1280" height="612" class="img_ev3q">
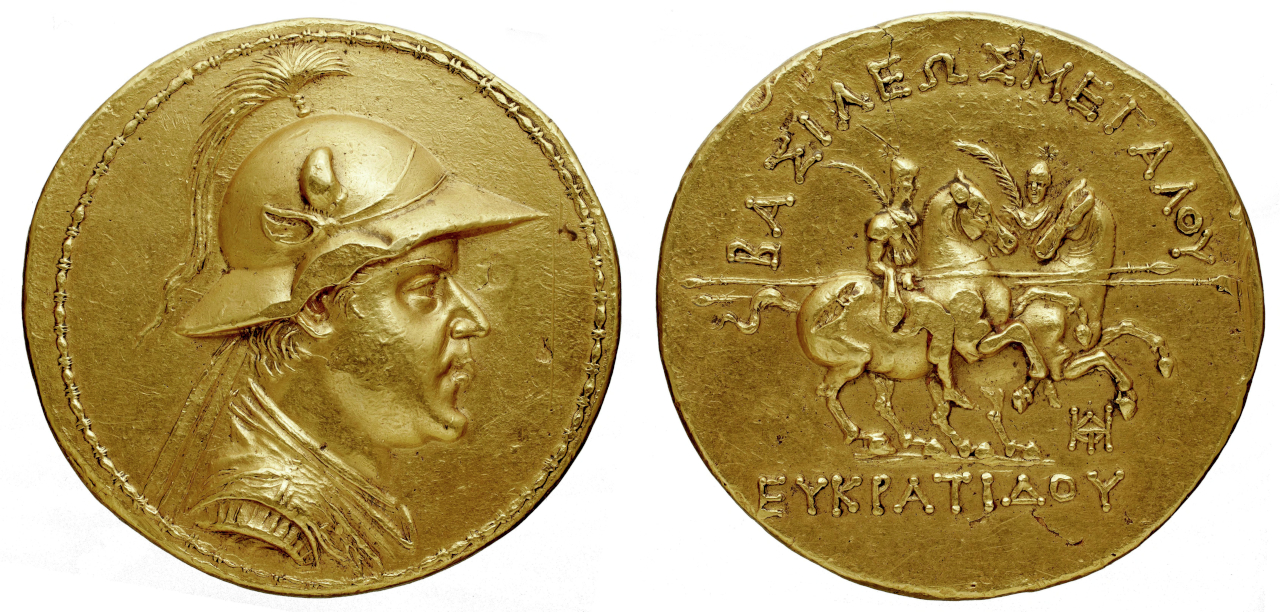
<em><small>Gold coin of Eucratides I (171–145 BC), a Greco-Bactrian king. Unearthed at Ai-Khanoum, in today's Afghanistan, it is the largest known gold coin minted in antiquity.</small></em></p>
<!-- -->
<h2 class="anchor anchorTargetStickyNavbar_Vzrq" id="gold-investment-or-money">Gold: Investment or Money?<a href="https://nanx.io/blog/gold-shadow-price#gold-investment-or-money" class="hash-link" aria-label="Direct link to Gold: Investment or Money?" title="Direct link to Gold: Investment or Money?" translate="no">​</a></h2>
<p>In a market economy, gold occupies a unique position. Unlike stocks, bonds, and other financial assets, gold is not an investment; it is a <strong>monetary asset</strong>. That means the classic valuation methods, based on discounting future cash flows as we would with a stock or a bond, simply do not apply. Gold pays no yield and no dividends; it produces no cash flows over time. This is why well-known investors such as Warren Buffett and Charlie Munger have questioned its role as an "investment."</p>
<p>Buffett, for one, sorts assets into three categories:</p>
<ol>
<li class="">Currency-based investments: Treasury bonds, corporate bonds, and the like.</li>
<li class="">Assets that produce nothing and are bought only in the hope that someone will pay more for them later. Gold sits here.</li>
<li class="">Productive assets, whose value lies in their ability to generate returns, such as stocks that produce profits and dividends.</li>
</ol>
<p>But writing gold off as an inert asset, or a purely speculative bet, rests on an <strong>erroneous premise: that gold is an investment</strong>. Gold is not an investment; <strong>it is a monetary asset</strong>. It is money, and as such it has historically performed the three classic functions of money:</p>
<ol>
<li class=""><strong>Medium of exchange</strong>: facilitating the trade of goods and services.</li>
<li class=""><strong>Unit of account</strong>: serving as the market's common measure of value.</li>
<li class=""><strong>Store of value</strong>: allowing wealth to be stored and transferred across space and time.</li>
</ol>
<p>So if cash-flow valuation does not apply, how do we anchor a price for gold? We need a different frame of reference: the relationship between a central bank's gold reserves and the monetary base it issues. In this post, we will look at the Fed's gold reserves against M0, the monetary base in dollars issued by the Federal Reserve.</p>
<h2 class="anchor anchorTargetStickyNavbar_Vzrq" id="gold-as-currency-throughout-history">Gold as Currency Throughout History<a href="https://nanx.io/blog/gold-shadow-price#gold-as-currency-throughout-history" class="hash-link" aria-label="Direct link to Gold as Currency Throughout History" title="Direct link to Gold as Currency Throughout History" translate="no">​</a></h2>
<p>Gold has served as money across civilizations since about 600 BC, when the Lydians minted the first coins, made of <em>electrum</em>, a naturally occurring gold-silver alloy. For centuries thereafter, the gold standard anchored the value of most national currencies, until 1971, when President Nixon suspended the dollar's convertibility into gold. That was a turning point: the world began to operate without any formal link to the metal, ushering in the era of fully fiat currencies.</p>
<p>The decoupling was completed at the end of the 20th century, when Switzerland, considered the last major currency still partially backed by gold, also removed its official link to the metal. Even so, the historical record stands: for over 2,600 years, gold worked as money. Today, by contrast, we live in what amounts to an unprecedented <strong>monetary experiment</strong>, with no formal linkage to gold at all.</p>
<p>Despite the official separation, central banks still treat gold as money. They keep accumulating reserves, which they hold on their balance sheets much like a "foreign currency." Although these reserves no longer officially back the currency issued, they provide stability and credibility, acting as an anchor of value in times of inflationary crisis or lost confidence. Some of today's largest official gold holders:</p>
<table><thead><tr><th>Country</th><th style="text-align:right">Reserves (tonnes)</th></tr></thead><tbody><tr><td>United States of America</td><td style="text-align:right">8,133.46</td></tr><tr><td>Germany</td><td style="text-align:right">3,351.53</td></tr><tr><td>IMF</td><td style="text-align:right">2,814.03</td></tr><tr><td>Italy</td><td style="text-align:right">2,451.84</td></tr><tr><td>France</td><td style="text-align:right">2,436.94</td></tr><tr><td>Russia</td><td style="text-align:right">2,332.74</td></tr><tr><td>China</td><td style="text-align:right">2,264.32</td></tr><tr><td>Switzerland</td><td style="text-align:right">1,039.94</td></tr></tbody></table>
<p>The weight of these reserves relative to the currency in circulation has fallen over time, especially after the Bretton Woods system collapsed in 1971. Even so, the metal remains an important part of central bank strategy, even if its proportional weight is no longer what it was under the classical gold standard.</p>
<h2 class="anchor anchorTargetStickyNavbar_Vzrq" id="valuation-methodology-the-shadow-price-of-gold">Valuation Methodology: The Shadow Price of Gold<a href="https://nanx.io/blog/gold-shadow-price#valuation-methodology-the-shadow-price-of-gold" class="hash-link" aria-label="Direct link to Valuation Methodology: The Shadow Price of Gold" title="Direct link to Valuation Methodology: The Shadow Price of Gold" translate="no">​</a></h2>
<p>Since gold is money rather than an investment, we can ask: <strong>what price would gold need to have to keep a meaningful historical relationship with the currency in circulation?</strong></p>
<p>The shadow price of gold comes from comparing the gold reserves held by a central bank with the monetary base (M0) it issues: the total of physical currency in circulation plus the reserves commercial banks hold at the central bank. Historically, that relationship was far more stable than it is today. Focusing on the U.S. dollar and looking back at the gold-standard era, we find that the value of gold reserves averaged about 25% of the monetary base. In other words, at key moments in history, the gold in the vault was worth roughly one-quarter of all the currency issued.</p>
<p>The idea behind the shadow price is this: in a severe inflationary crisis, if the Federal Reserve wanted to restore gold backing to that historical 25% of the currency in circulation (to shore up confidence in the monetary system), the price of gold would have to adjust upward.</p>
<p>That adjustment could happen in several ways:</p>
<ul>
<li class="">Central banks buy more gold for their reserves, and the extra demand pushes the price higher.</li>
<li class="">The currency depreciates (inflation), raising gold's price in dollar terms because the dollar itself is worth less.</li>
</ul>
<p>We can express the shadow price as:</p>
<span class="katex-display"><span class="katex"><span class="katex-mathml"><math xmlns="http://www.w3.org/1998/Math/MathML" display="block"><semantics><mrow><mtext>shadow&nbsp;price</mtext><mo>=</mo><mfrac><mrow><mn>0.25</mn><mo>×</mo><mtext>monetary&nbsp;base&nbsp;(M0)</mtext></mrow><mtext>gold&nbsp;reserves&nbsp;(troy&nbsp;ounces)</mtext></mfrac></mrow><annotation encoding="application/x-tex">\text{shadow price} = \frac{0.25 \times \text{monetary base (M0)}}{\text{gold reserves (troy ounces)}}</annotation></semantics></math></span><span class="katex-html" aria-hidden="true"><span class="base"><span class="strut" style="height:0.8889em;vertical-align:-0.1944em"></span><span class="mord text"><span class="mord">shadow&nbsp;price</span></span><span class="mspace" style="margin-right:0.2778em"></span><span class="mrel">=</span><span class="mspace" style="margin-right:0.2778em"></span></span><span class="base"><span class="strut" style="height:2.363em;vertical-align:-0.936em"></span><span class="mord"><span class="mopen nulldelimiter"></span><span class="mfrac"><span class="vlist-t vlist-t2"><span class="vlist-r"><span class="vlist" style="height:1.427em"><span style="top:-2.314em"><span class="pstrut" style="height:3em"></span><span class="mord"><span class="mord text"><span class="mord">gold&nbsp;reserves&nbsp;(troy&nbsp;ounces)</span></span></span></span><span style="top:-3.23em"><span class="pstrut" style="height:3em"></span><span class="frac-line" style="border-bottom-width:0.04em"></span></span><span style="top:-3.677em"><span class="pstrut" style="height:3em"></span><span class="mord"><span class="mord">0.25</span><span class="mspace" style="margin-right:0.2222em"></span><span class="mbin">×</span><span class="mspace" style="margin-right:0.2222em"></span><span class="mord text"><span class="mord">monetary&nbsp;base&nbsp;(M0)</span></span></span></span></span><span class="vlist-s">​</span></span><span class="vlist-r"><span class="vlist" style="height:0.936em"><span></span></span></span></span></span><span class="mclose nulldelimiter"></span></span></span></span></span></span>
<p>Here is the current arithmetic for the U.S. dollar:</p>
<span class="katex-display"><span class="katex"><span class="katex-mathml"><math xmlns="http://www.w3.org/1998/Math/MathML" display="block"><semantics><mrow><mi>M</mi><mn>0</mn><mo>≈</mo><mn>5,567.2</mn><mtext>&nbsp;billion&nbsp;USD</mtext></mrow><annotation encoding="application/x-tex">M0 \approx 5{,}567.2\ \text{billion USD}</annotation></semantics></math></span><span class="katex-html" aria-hidden="true"><span class="base"><span class="strut" style="height:0.6833em"></span><span class="mord mathnormal" style="margin-right:0.109em">M</span><span class="mord">0</span><span class="mspace" style="margin-right:0.2778em"></span><span class="mrel">≈</span><span class="mspace" style="margin-right:0.2778em"></span></span><span class="base"><span class="strut" style="height:0.8889em;vertical-align:-0.1944em"></span><span class="mord">5</span><span class="mord"><span class="mpunct">,</span></span><span class="mord">567.2</span><span class="mspace">&nbsp;</span><span class="mord text"><span class="mord">billion&nbsp;USD</span></span></span></span></span></span>
<span class="katex-display"><span class="katex"><span class="katex-mathml"><math xmlns="http://www.w3.org/1998/Math/MathML" display="block"><semantics><mrow><mtext>Fed’s&nbsp;gold&nbsp;reserves</mtext><mo>=</mo><mn>261.5</mn><mtext>&nbsp;million&nbsp;troy&nbsp;ounces</mtext></mrow><annotation encoding="application/x-tex">\text{Fed's gold reserves} = 261.5\ \text{million troy ounces}</annotation></semantics></math></span><span class="katex-html" aria-hidden="true"><span class="base"><span class="strut" style="height:0.8889em;vertical-align:-0.1944em"></span><span class="mord text"><span class="mord">Fed’s&nbsp;gold&nbsp;reserves</span></span><span class="mspace" style="margin-right:0.2778em"></span><span class="mrel">=</span><span class="mspace" style="margin-right:0.2778em"></span></span><span class="base"><span class="strut" style="height:0.8889em;vertical-align:-0.1944em"></span><span class="mord">261.5</span><span class="mspace">&nbsp;</span><span class="mord text"><span class="mord">million&nbsp;troy&nbsp;ounces</span></span></span></span></span></span>
<p>Working in millions (5,567.2 billion equals 5,567,200 million), we get:</p>
<span class="katex-display"><span class="katex"><span class="katex-mathml"><math xmlns="http://www.w3.org/1998/Math/MathML" display="block"><semantics><mrow><mtext>shadow&nbsp;price</mtext><mo>=</mo><mfrac><mrow><mn>0.25</mn><mo>×</mo><mn>5,567,200</mn></mrow><mn>261.5</mn></mfrac><mo>≈</mo><mn>5,322</mn><mtext>&nbsp;USD&nbsp;per&nbsp;troy&nbsp;ounce</mtext></mrow><annotation encoding="application/x-tex">\text{shadow price} = \frac{0.25 \times 5{,}567{,}200}{261.5} \approx 5{,}322\ \text{USD per troy ounce}</annotation></semantics></math></span><span class="katex-html" aria-hidden="true"><span class="base"><span class="strut" style="height:0.8889em;vertical-align:-0.1944em"></span><span class="mord text"><span class="mord">shadow&nbsp;price</span></span><span class="mspace" style="margin-right:0.2778em"></span><span class="mrel">=</span><span class="mspace" style="margin-right:0.2778em"></span></span><span class="base"><span class="strut" style="height:2.0074em;vertical-align:-0.686em"></span><span class="mord"><span class="mopen nulldelimiter"></span><span class="mfrac"><span class="vlist-t vlist-t2"><span class="vlist-r"><span class="vlist" style="height:1.3214em"><span style="top:-2.314em"><span class="pstrut" style="height:3em"></span><span class="mord"><span class="mord">261.5</span></span></span><span style="top:-3.23em"><span class="pstrut" style="height:3em"></span><span class="frac-line" style="border-bottom-width:0.04em"></span></span><span style="top:-3.677em"><span class="pstrut" style="height:3em"></span><span class="mord"><span class="mord">0.25</span><span class="mspace" style="margin-right:0.2222em"></span><span class="mbin">×</span><span class="mspace" style="margin-right:0.2222em"></span><span class="mord">5</span><span class="mord"><span class="mpunct">,</span></span><span class="mord">567</span><span class="mord"><span class="mpunct">,</span></span><span class="mord">200</span></span></span></span><span class="vlist-s">​</span></span><span class="vlist-r"><span class="vlist" style="height:0.686em"><span></span></span></span></span></span><span class="mclose nulldelimiter"></span></span><span class="mspace" style="margin-right:0.2778em"></span><span class="mrel">≈</span><span class="mspace" style="margin-right:0.2778em"></span></span><span class="base"><span class="strut" style="height:0.8778em;vertical-align:-0.1944em"></span><span class="mord">5</span><span class="mord"><span class="mpunct">,</span></span><span class="mord">322</span><span class="mspace">&nbsp;</span><span class="mord text"><span class="mord">USD&nbsp;per&nbsp;troy&nbsp;ounce</span></span></span></span></span></span>
<p>That yields a shadow price of roughly 5,322 USD per troy ounce. In other words, it shows where gold would need to trade for the Fed, or the market, to restore the historical ratio of 25% gold backing relative to the currency in circulation.</p>
<h2 class="anchor anchorTargetStickyNavbar_Vzrq" id="the-spotshadow-ratio-overvalued-or-undervalued-gold">The Spot/Shadow Ratio: Overvalued or Undervalued Gold?<a href="https://nanx.io/blog/gold-shadow-price#the-spotshadow-ratio-overvalued-or-undervalued-gold" class="hash-link" aria-label="Direct link to The Spot/Shadow Ratio: Overvalued or Undervalued Gold?" title="Direct link to The Spot/Shadow Ratio: Overvalued or Undervalued Gold?" translate="no">​</a></h2>
<p>The spot/shadow ratio compares two gold prices: the current market price (the <em>spot</em> price) and the <em>shadow</em> price defined above:</p>
<span class="katex-display"><span class="katex"><span class="katex-mathml"><math xmlns="http://www.w3.org/1998/Math/MathML" display="block"><semantics><mrow><mtext>ratio</mtext><mo>=</mo><mfrac><mtext>spot&nbsp;price</mtext><mtext>shadow&nbsp;price</mtext></mfrac></mrow><annotation encoding="application/x-tex">\text{ratio} = \frac{\text{spot price}}{\text{shadow price}}</annotation></semantics></math></span><span class="katex-html" aria-hidden="true"><span class="base"><span class="strut" style="height:0.6679em"></span><span class="mord text"><span class="mord">ratio</span></span><span class="mspace" style="margin-right:0.2778em"></span><span class="mrel">=</span><span class="mspace" style="margin-right:0.2778em"></span></span><span class="base"><span class="strut" style="height:2.2253em;vertical-align:-0.8804em"></span><span class="mord"><span class="mopen nulldelimiter"></span><span class="mfrac"><span class="vlist-t vlist-t2"><span class="vlist-r"><span class="vlist" style="height:1.3449em"><span style="top:-2.314em"><span class="pstrut" style="height:3em"></span><span class="mord"><span class="mord text"><span class="mord">shadow&nbsp;price</span></span></span></span><span style="top:-3.23em"><span class="pstrut" style="height:3em"></span><span class="frac-line" style="border-bottom-width:0.04em"></span></span><span style="top:-3.677em"><span class="pstrut" style="height:3em"></span><span class="mord"><span class="mord text"><span class="mord">spot&nbsp;price</span></span></span></span></span><span class="vlist-s">​</span></span><span class="vlist-r"><span class="vlist" style="height:0.8804em"><span></span></span></span></span></span><span class="mclose nulldelimiter"></span></span></span></span></span></span>
<p>With, for example, a spot price of around 2,600 USD and a shadow price of 5,322 USD:</p>
<span class="katex-display"><span class="katex"><span class="katex-mathml"><math xmlns="http://www.w3.org/1998/Math/MathML" display="block"><semantics><mrow><mfrac><mn>2,600</mn><mn>5,322</mn></mfrac><mo>≈</mo><mn>0.5</mn></mrow><annotation encoding="application/x-tex">\frac{2{,}600}{5{,}322} \approx 0.5</annotation></semantics></math></span><span class="katex-html" aria-hidden="true"><span class="base"><span class="strut" style="height:2.2019em;vertical-align:-0.8804em"></span><span class="mord"><span class="mopen nulldelimiter"></span><span class="mfrac"><span class="vlist-t vlist-t2"><span class="vlist-r"><span class="vlist" style="height:1.3214em"><span style="top:-2.314em"><span class="pstrut" style="height:3em"></span><span class="mord"><span class="mord">5</span><span class="mord"><span class="mpunct">,</span></span><span class="mord">322</span></span></span><span style="top:-3.23em"><span class="pstrut" style="height:3em"></span><span class="frac-line" style="border-bottom-width:0.04em"></span></span><span style="top:-3.677em"><span class="pstrut" style="height:3em"></span><span class="mord"><span class="mord">2</span><span class="mord"><span class="mpunct">,</span></span><span class="mord">600</span></span></span></span><span class="vlist-s">​</span></span><span class="vlist-r"><span class="vlist" style="height:0.8804em"><span></span></span></span></span></span><span class="mclose nulldelimiter"></span></span><span class="mspace" style="margin-right:0.2778em"></span><span class="mrel">≈</span><span class="mspace" style="margin-right:0.2778em"></span></span><span class="base"><span class="strut" style="height:0.6444em"></span><span class="mord">0.5</span></span></span></span></span>
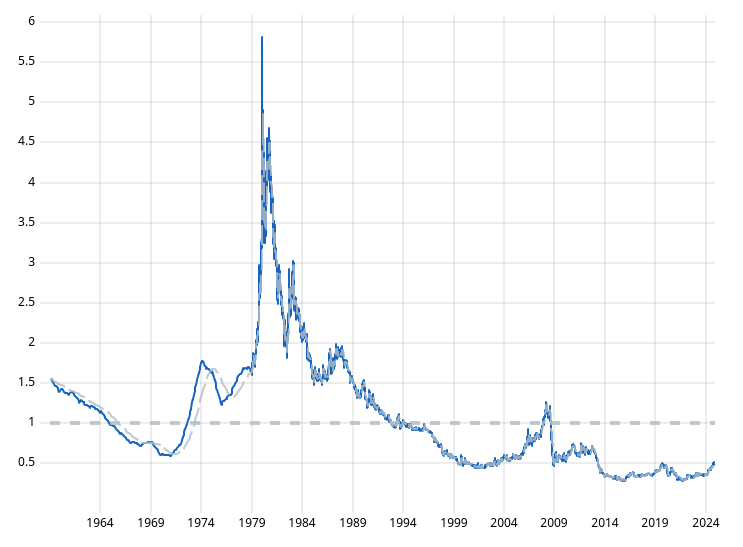
<p>A ratio below 1 means gold is <strong>undervalued</strong> relative to the historical 25% target: restoring that proportion would take roughly a doubling of the price. <strong>The U.S. spot/shadow ratio has averaged about 1 since 1959</strong>, which suggests that for long stretches of history gold tracked that 25% threshold quite closely.</p>
<p>The all-time high, 5.81, came on January 21, 1980: the peak of the 1970s inflation crisis, just before Paul Volcker's tight monetary policy began to break inflation. That marked an extreme moment, with the market pricing gold far above what 25% backing would justify.</p>
<p><img decoding="async" loading="lazy" alt="Spot/Shadow ratio" src="https://nanx.io/assets/images/spot_shadow_ratio-dd15aecde97e35fdd8e806f8e873e01b.png" width="743" height="547" class="img_ev3q">
<em>Spot/Shadow ratio from 1964 to 2024. Source: nanx.io</em></p>
<h2 class="anchor anchorTargetStickyNavbar_Vzrq" id="summary">Summary<a href="https://nanx.io/blog/gold-shadow-price#summary" class="hash-link" aria-label="Direct link to Summary" title="Direct link to Summary" translate="no">​</a></h2>
<p>The shadow price is a conceptual tool, not a price forecast. It frames how gold might be valued if certain historical monetary conditions were restored, and it measures the gap between today's world and a scenario in which gold regains a more central role as a monetary anchor.</p>
<p>This methodology does not claim that gold will reach its shadow price. What it does show is gold's latent potential as a store of value in a world of expanding monetary bases and inflationary uncertainty.</p>
<h2 class="anchor anchorTargetStickyNavbar_Vzrq" id="sources">Sources<a href="https://nanx.io/blog/gold-shadow-price#sources" class="hash-link" aria-label="Direct link to Sources" title="Direct link to Sources" translate="no">​</a></h2>
<ul>
<li class="">World Gold Council: historical gold reserves data by country.</li>
<li class=""><a href="http://gold-api.com/" target="_blank" rel="noopener noreferrer" class="">gold-api.com</a>: spot gold price.</li>
<li class="">Federal Reserve Bank of St. Louis: historical data for the U.S. monetary base (M0).</li>
<li class="">International Monetary Fund: information on the Federal Reserve's gold reserves.</li>
</ul>]]></content>
    </entry>
    <entry>
        <title type="html"><![CDATA[About nanx.io]]></title>
        <id>https://nanx.io/blog/about-nanx-io</id>
        <link href="https://nanx.io/blog/about-nanx-io"/>
        <updated>2026-08-23T00:00:00.000Z</updated>
        <summary type="html"><![CDATA[nanx.io is an accounting analysis tool designed to help the DIY investor with the quantitative part of investing.]]></summary>
        <content type="html"><![CDATA[<p><strong>TL;DR:</strong> <strong><a class="" href="https://nanx.io/">nanx.io</a></strong> helps investors by <strong>systematizing fundamental analysis</strong> of public companies. We take the complexity of accounting, plus all the information <em>noise</em> investors face, and distill it into a set of normalized, easy-to-use scores covering the most important aspects of a company's finances.</p>
<p><img decoding="async" loading="lazy" alt="Courtyard of the Amsterdam Stock Exchange" src="https://nanx.io/assets/images/amsterdam-exchange-1280-700px-ef2b1e0558e4270c238a9439b89c319b.jpeg" width="1280" height="700" class="img_ev3q">
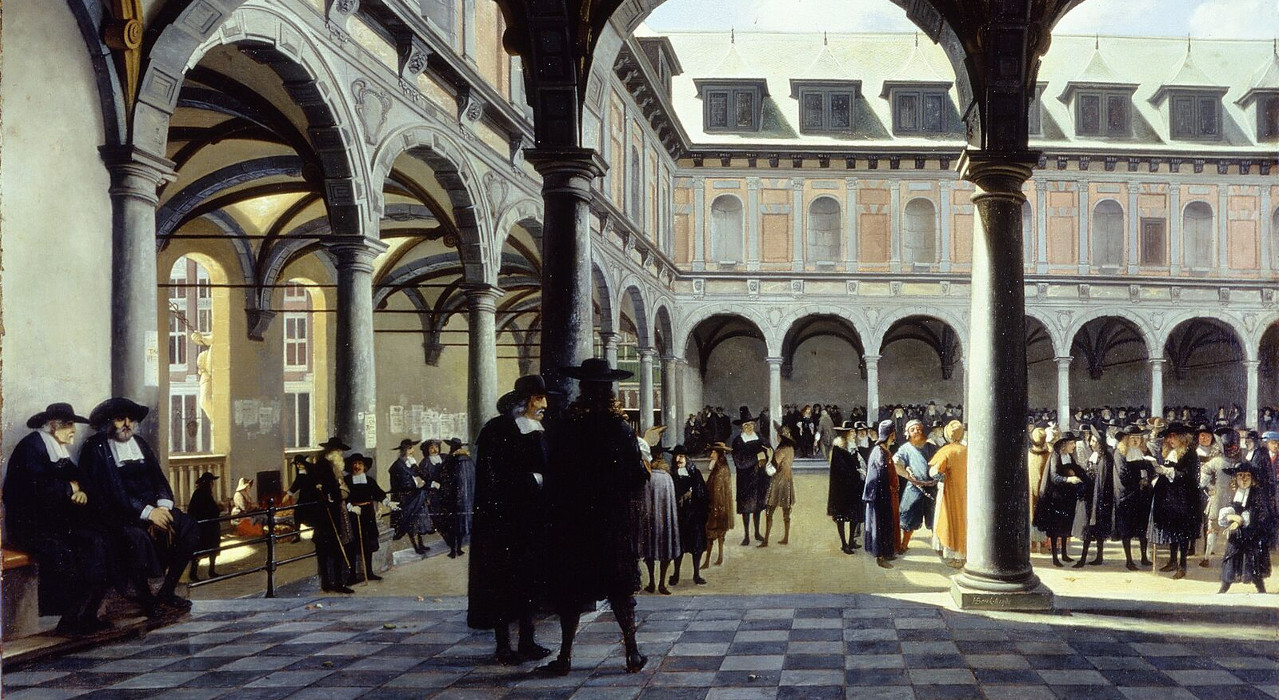
<em>Courtyard of one of the world's first stock exchanges. Amsterdam, circa 1670.</em></p>
<!-- -->
<p>Investing is hard. It takes more than a few courses and books to master, and there is still no single, settled theory to guide you through it. nanx.io helps you cut through this complexity by systematizing the fundamental analysis of companies.</p>
<p>Every company investment boils down to three fundamental questions: how <strong>profitable</strong> the company is, how <strong>solvent</strong> it is, and whether its <strong>price</strong> is fair. Put another way:</p>
<ol>
<li class="">Is it <strong>profitable</strong>? Will we get back more capital than we put into it?</li>
<li class="">Is it <strong>solvent</strong>? Can it keep operating as usual without burning through capital just to pay down its liabilities?</li>
<li class="">Is its <strong>price</strong> on the secondary market reasonable, in line with its profitability and solvency?</li>
</ol>
<p>nanx.io automates the calculation of these three variables using state-of-the-art accounting analysis techniques. Our methodology builds on the <a href="https://en.wikipedia.org/wiki/Value_investing" target="_blank" rel="noopener noreferrer" class="">Value Investing</a> framework (especially for the <em>price/free cash flow score</em>) and on the <a href="https://en.wikipedia.org/wiki/Austrian_School" target="_blank" rel="noopener noreferrer" class="">Austrian School of Economics</a>.</p>
<h2 class="anchor anchorTargetStickyNavbar_Vzrq" id="using-the-scores">Using the Scores<a href="https://nanx.io/blog/about-nanx-io#using-the-scores" class="hash-link" aria-label="Direct link to Using the Scores" title="Direct link to Using the Scores" translate="no">​</a></h2>
<p>The math behind the scores is complex; using them is not. Every score is normalized to a 0-to-10 scale, so you can grasp it at a glance.</p>
<p>For example, take a company with these scores:</p>
<ul>
<li class="">Firm profitability score = 8</li>
<li class="">Dynamic solvency score = 9</li>
<li class="">Price/free cash flow score = 2</li>
</ul>
<p>You will see this pattern over and over: highly profitable, solvent companies tend to be expensive. Everybody wants them in their portfolio, that demand pushes the price up, and the valuation ends up stretched.</p>
<p>The ideal investment scores high on all three fronts. Companies like that are rare in bull markets and much easier to find in bear markets. nanx.io includes a very powerful screening tool to help you hunt them down.</p>
<h2 class="anchor anchorTargetStickyNavbar_Vzrq" id="main-scores">Main Scores<a href="https://nanx.io/blog/about-nanx-io#main-scores" class="hash-link" aria-label="Direct link to Main Scores" title="Direct link to Main Scores" translate="no">​</a></h2>
<p>The <strong>investment score</strong> is the headline number: it summarizes profitability, solvency, and price into a single value.</p>
<p>It combines two sub-scores. The <strong>quality score</strong> reflects the company's economic profitability, while the <strong>price score</strong> reflects whether the stock trades at a fair price on the secondary market.</p>
<p>In short, the investment score gives you an at-a-glance view of a company's financial health plus its stock's valuation.</p>
<h2 class="anchor anchorTargetStickyNavbar_Vzrq" id="solvency">Solvency<a href="https://nanx.io/blog/about-nanx-io#solvency" class="hash-link" aria-label="Direct link to Solvency" title="Direct link to Solvency" translate="no">​</a></h2>
<p>Few things hit a stock price as hard and as fast as insolvency. Our <em>dynamic solvency score</em> helps you steer clear of companies at risk of going under.</p>
<p>It could have kept you out of names like <strong>China Evergrande Group</strong>, which fell into technical default in 2021; <strong>Eastman Kodak</strong>, which filed for bankruptcy in 2012; and <strong>General Motors</strong>, which filed for Chapter 11 in 2009. In all three cases, our <em>dynamic solvency score</em> had already dropped to <strong>zero</strong> long before the trouble became public knowledge: Evergrande since June 2019, Kodak since 2009, and General Motors since 2008.</p>
<h2 class="anchor anchorTargetStickyNavbar_Vzrq" id="other-scores">Other Scores<a href="https://nanx.io/blog/about-nanx-io#other-scores" class="hash-link" aria-label="Direct link to Other Scores" title="Direct link to Other Scores" translate="no">​</a></h2>
<p>Beyond the scores above, nanx.io computes another 20+ scores per company. Each one is our take on an existing, state-of-the-art accounting analysis technique. A few examples:</p>
<ul>
<li class="">
<p>The <em>dynamic</em> and <em>static</em> solvency scores draw on the solvency research of <strong>Vicente García Martín</strong> and <strong>Manuel Fernández Gámez</strong>, professors at the <em>University of Málaga</em> who have built one of the most comprehensive solvency analysis frameworks available.</p>
</li>
<li class="">
<p>The valuation scores (<em>price/free cash flow</em>, <em>price/balance</em>, and <em>price/free earnings</em>) follow the value investing framework. They compare the stock's market price with the company's free cash flows, balance sheet structure, and free earnings.</p>
</li>
<li class="">
<p>The <em>zone score</em> is based on the "Index of Economic Freedom" published by the <a href="https://www.heritage.org/index/" target="_blank" rel="noopener noreferrer" class="">Heritage Foundation</a>.</p>
</li>
<li class="">
<p>And more, each covering an aspect of the company that matters from an investor's point of view.</p>
</li>
</ul>]]></content>
    </entry>
</feed>